
Storytelling: Comics, Journalism, Visualization, and the Brain
 Understanding Comics – The Invisible Art
 Understanding Comics – The Invisible Art
In my last post about favorite books I made an error leaving out Scott McCloud’s Understanding Comics. With all the talk/blogging/tweeting about the power of story, I’m surprised this book is not mentioned more often. It’s storytelling gold. In it we learn about how the unique medium of comic books is used to drive a story. And how the physical constraints of a page turning medium actually create storytelling possibilities, and not limitations. The elements of time and space, and how comic artists represent them in their art is fascinating.
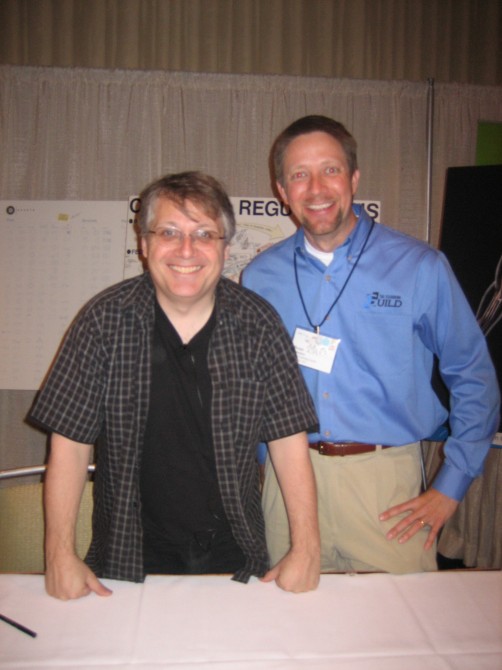
Scott McCloud, Author of Understanding Comics & Brent Schlenker Litmos, Chief Learning Strategist
If you’re looking for something a little more current than 1993 than you might be more interested in his followup book, Reinventing Comics released in 2000, or Making Comics in 2006. But despite being a little older, Understanding Comics still holds it’s own as a must read in my collection.
In 2008 I was speaking at the first VizThink conference, and had the pleasure of hearing Scott speak, and appreciated hearing his insights first hand. It’s always a pleasure to meet people who are passionate about their work, and just genuinely happy. If you ever get a chance to hear him speak I would highly recommend that you do.
As I was thinking about this post many connections became clearer to me. However one in particular stood out the most: Vision. The importance of visualizing data is popular in the form of infographics. And obviously, telling stories with images, pictures, and artistic form, is powerful. But why? It’s our brain. Dr. Medina highlights vision as “Brain Rule #10: Vision trumps all other senses.”
Journalism in the Age of Data
In my quest for more connections I came across this little gem: Journalism in the Age of Data. It’s sort of an interactive documentary piece. If you are new to data, visualization, storytelling, and the new technologies available to you, then you must take some time to watch this.
And if you want to geek out on data for a living then just skip right to chapter 8 titled, “First Steps”. And just get started.
It’s important to note that it’s fringe areas like visualization that will make you a better eLearning designer. Stretch your skills a little and look into how you can help people learn through comics, or better visualizing data to improve comprehension.
Story-telling, brain research, data visualization, graphic arts, and statistical analysis are all important to learning. They may seem like an odd collection of studies, but I hope you can see the value in understanding enough of each to level up your career game.