TRAINING COURSE CATALOG
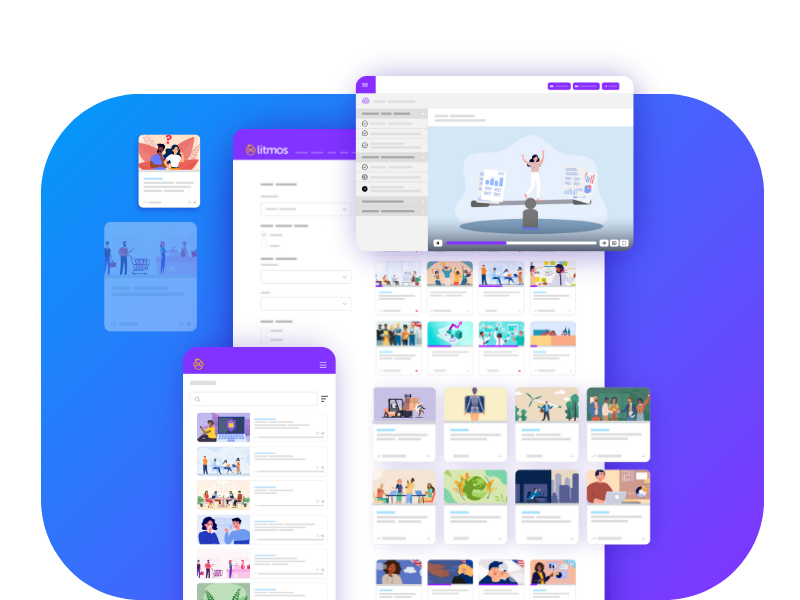
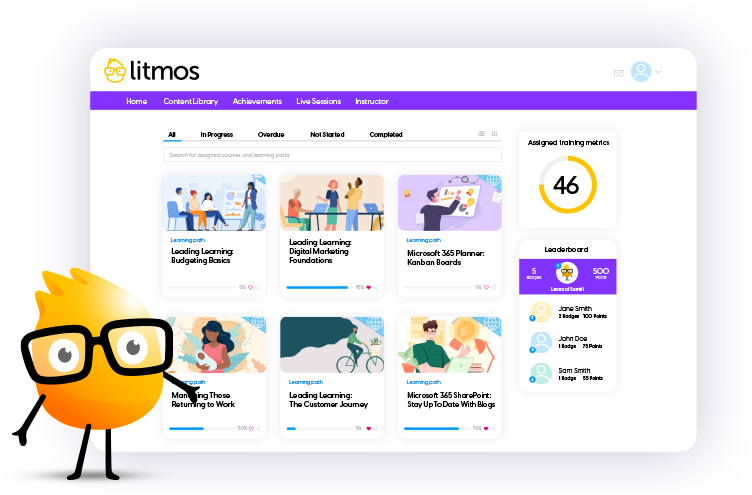
An ever-growing library of relevant training courses
Award-winning training content collections for your employees, customers, and partners across the globe. Our collections include thousands of courses professionally created for a more productive workplace.
Re-skill, upskill, or fill worker skill gaps and minimize risk with compliance training. Support retention and career mobility and best of all, create a positive culture.


